A summary of the reporting available to institutions
Capsule reporting lets you see:
Case Specialty
League tables
Cohort Activity
Case Activity
Student progress
Reporting availability depends on your permission, please contact your Capsule Administrator if you’re unable to access any of the links below. All reporting can be accessed via the desktop version only.
Case specialty reports and league tables can be accessed via the admin
1. Follow this link to launch the Admin and login with your Capsule account:
1.1 Once in the admin, the reports can be access through the ‘Reports’ section on the left hand menu:

Case Specialty
2. To view the case specialty export simply select ‘Case Specialty’ from the drop-down menu.
2.2 This gives you a summary view of every Capsule case and the performance of your students, including the total number of cases completed, and the average scores from all attempts.
This can be used to view:
Scores by case to evaluate areas of clinical excellence and areas for improvement
Grouped engagement by cases and categories
Student engagement by time
Filtering is possible by date, cohort/year of study and case categories.
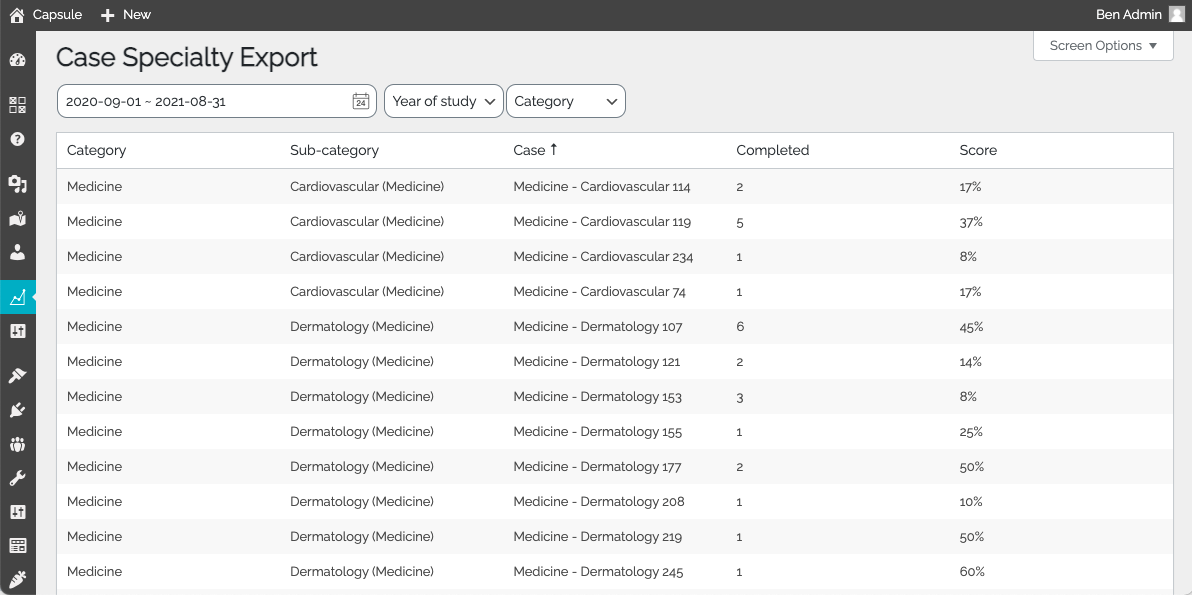
This data can be exported in CSV by selecting ‘Download CSV’ at the bottom left of the table. Use this to analyse with other data sets in software such as Excel.
League Tables
3. Select ‘League Table’ from the drop-down menu underneath ‘Reports’.

3.1 Now select the time period you would like to view the league table for. Do this by selecting dates from the calendar drop down.

3.2 You can also filter by which year you would like to include in the league table. Do this by choosing from the drop down menu under ‘All Years’.
3.3 This will show you a league table with all users, average score, display name, their total cases and year.
Case activity, cohort comparison and student progress can be accessed via the ‘staff’ section on the platform
4. Follow this link to launch the ‘Staff’ section of the platform, log in with your Capsule account:
Case activity
Case activity allows you to see all the cases which are being completed and by which students or year groups. It’s an easy way to see which case categories are most and least popular.
5. Now you are in the ‘Staff’ section of the platform, click the ‘Cohort Progress’ tab. Then you will be presented with two options ‘Case Activity’ and ‘Cohort Comparison’ click ‘Case Activity’.
5.1 From here you’ll be presented with all the cases that have been completed by your students. Use the ‘Date Range’ section to filter by time and use the ‘Select a Cohort’ section to choose which year you would like to view case activity for.
5.2 Select from the specialty tabs (can be seen below) to see how many cases in each category have been completed.

5.3 Use the ‘Export’ button in the bottom left of the screen to download the data.

Cohort comparison
Compare case attempts and average scores against a whole cohort to track relative engagement and performance.
6. Go to the ‘Staff’ tab then click ‘Cohort Progress’ and then ‘Cohort Comparison’.
6.1 Select the date range you would like to analyse from the ‘Date range’ drop-down menu.
6.2 Select which cohort you want to see from the ‘Select a Cohort’ drop-down menu.
6.3 Use the ‘Export’ button in the bottom left of the screen to download the data and compare cohorts.
Student Progress
Use this section of the app to see how each individual student is doing. This is good for highlighting which students are struggling so you can intervene early to ensure their exam results don’t suffer as a result.
7. Go to the ‘Staff’ tab then click ‘Student Progress’.
7.1 Use the search bar and type in the student’s name or email address (optionally within a single cohort) or simply by selecting and listing a whole cohort.
7.2 Click on the student and it will take you to their analytics dashboard. This shows you the number of cases they’ve completed, their average score compared to the cohort average, the number of cases they have completed in each category and their highest and lowest scoring category score.

7.3 Click on the ‘Case History’ tab to view which cases they have completed in a given time frame. You can filter by case category by clicking on the coloured tabs as shown below.

7.4 Click on the ‘Case Progress’ tab to see how many cases in each category they are completing each day.
7.5 Click on their ‘Profile’ tab to view all of their quizzes.